

Graph Convolutional Networks require Input data to be in a graph-structured format. Today, the most significant challenge among AI industry researchers, data scientists and ML engineers is.
How do you convert tabular data into graph-formatted data using Neo4j?
How do you visualise the GraphMl Data in Python and further GNN algorithms?
Recap from the previous GCN articles:
🔸 Tab2Graph-1 Conversion of Tabular to Graph using Python, Read here
🔸 For details on the graph data and Graph Neural Network, Read here.
🔸 For details on Graph ML Practical Applications, Read here.
This Article will explain in detail the graph data conversion.
Welcome, one and all, to the magical !!!
Core Contents of the Article
Let's discuss the tech content of this article; we will be discussing in detail about:
How to Create Database and Import CSV Tabular Data.
How to Convert the Nodes and the Edges.
Export of Graph data to GraphML and Understanding of the APOC config
We are importing GraphML data in Python using NetworkX.
How to Create Database and Import CSV Tabular Data.
To begin, we can start the download process for Neo4j Desktop, a Graph Database management tool. Follow the steps below:
Visit the official Neo4j website (neo4j.com) using your preferred web browser.
Locate the "Downloads" section on the website and click on it.
Please be sure to look for the Neo4j Desktop download option and click on it to start the download.
Depending on your operating system, choose the appropriate version (Windows, macOS, or Linux) and click on the download link.
Once the download is complete, please Navigate to the location where the file was saved and double-click on it to launch the installation process.
Follow the on-screen instructions provided by the installer to complete the installation of Neo4j Desktop on your system.
🔸 Step-1
After successfully installing Neo4j Desktop, I’d like to go ahead and create a new project and secure it with a password of your choice. Here's how:
Launch Neo4j Desktop by locating and opening the application on your computer.
On the welcome screen, click on the "Create a New Project" button or navigate to the "Projects" tab and click on the "New" button.
Provide a suitable name for your project in the designated field. Choose a descriptive name that reflects the purpose of your project.
In the "Password" field, enter a strong and secure password of your choice.
Finally, click on the "Create" or "Save" button to create the project with the specified name and password.
Congratulations! We have successfully created a new project in Neo4j Desktop and secured it with a password. Now, we can proceed with further configurations and utilise the power of Neo4j's Graph Database capabilities for the project.

🔸 Step-2
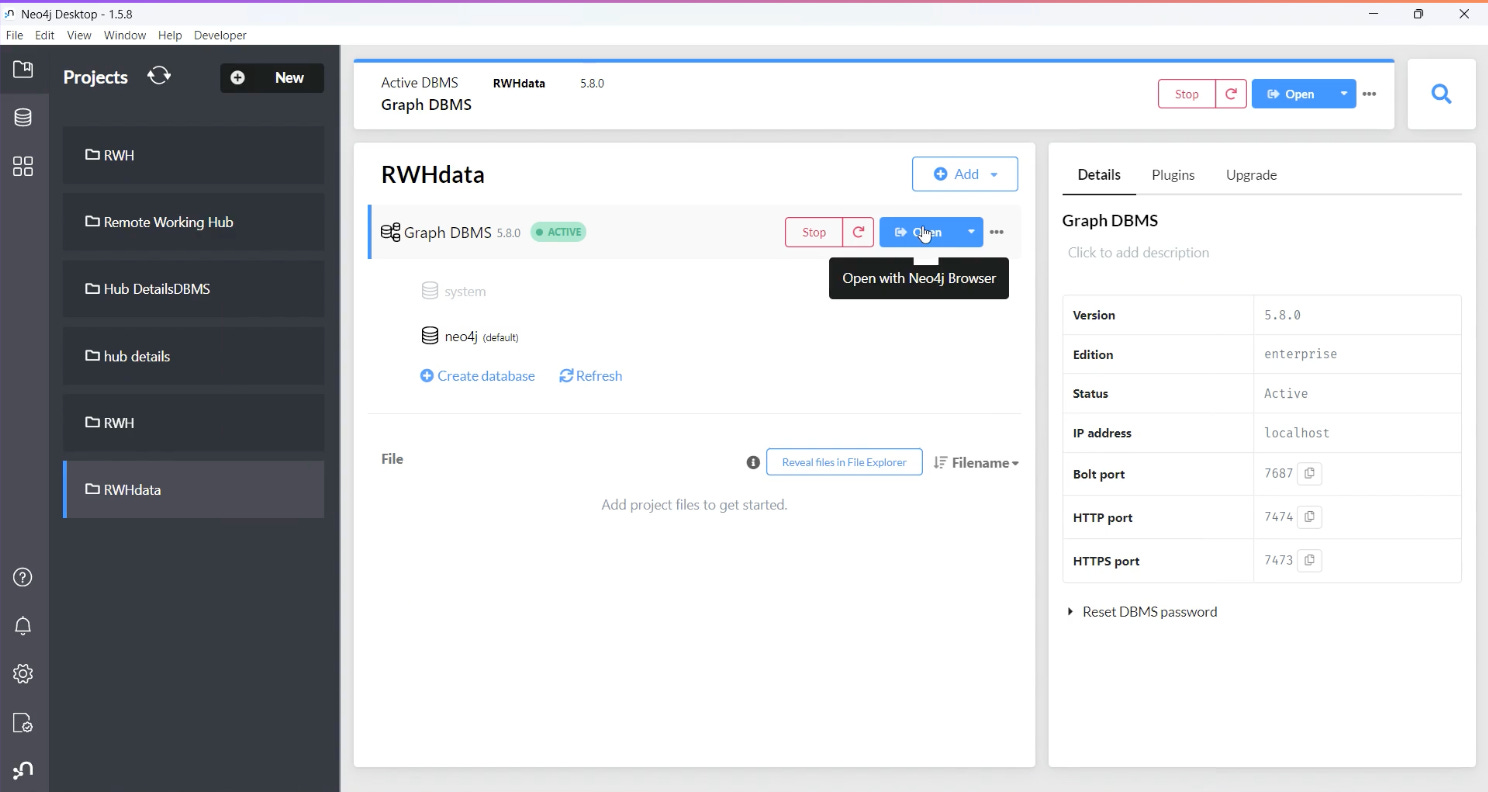
Once the project is successfully created, let’s keep the data file on a specified path. So, let's go to the path by clicking the three menu dots (…) next to the open button(Open with Neo4j Browser), which is in blue in Figure 2 of the Neo4j browser. Look at Figure 2 for the image.
Now, here, let's keep the file in its proper path; if not, we will get an error, so let's be very cautious here!
🔸 Step-3
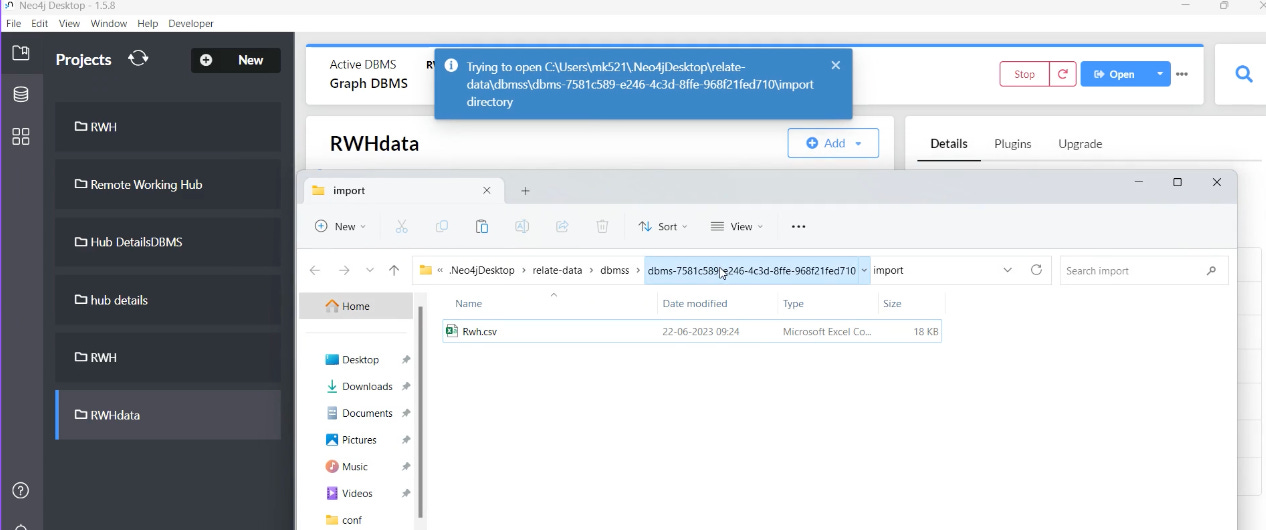
After clicking dots→click Openfolder→click Import, and then it opens a ( Copy and Past your CSV Tabular File) in Figure-3.

🔸 Step-4
Once we have successfully uploaded the CSV file, next we will click the open button to open the Neo4j Browser to start the conversion. Figure 4 shows you the exact location.

🔸 Step-5
Finally, here is the Neo4j Browser page for our created project.

How to Convert the Nodes and the Edges
Now, let us start the conversion process and map the nodes and edges appropriately.
🔸 Step-1
Let us write the cypher queries to load the CSV dataset and the count of rows.
LOAD CSV FROM 'file:///Rwh.csv' AS row
RETURN count(row);
🔸 Step-2
Please create a new node and connect the relationship between them.
We will create two types of nodes, namely "County" and "EirCode," and establish a relationship between them using a "Registered_EirCode" relationship.
MERGE (p:County {name: row.County})  --- creating County node
MERGE (e:EirCode {name: row.EirCode}) --- creating Eircode node
MERGE (p) -[:Registered_EirCode {Postal_Code:row.EirCode}]-> (e) --   connecting county node to eircode node
The above Cypher snippet explains,
MERGE (p:County {name: row.County})This line creates a "County" node in the graph. Imagine it as a representation of a county, like a county on a map.
The
row. Countyvalue is assigned to thenameproperty of the node, which could be the name of a county like "Dublin" or "Cork".If a node with the same name already exists, it will be used instead of creating a duplicate.
MERGE (e:EirCode {name: row.EirCode})This line creates an "EirCode" node. Think of an EirCode as a unique postal code for a location.
The
row.EirCodevalue is assigned to thenameproperty of the node. If a node with the same EirCode already exists, it will be used instead of creating a duplicate.
(p) -[:Registered_EirCode {Postal_Code:row.EirCode}]-> (e)
This part establishes a relationship between the "County" and "EirCode" nodes. Imagine this as drawing a line or connection between the county and the EirCode.
The line represents that the county is registered with the EirCode. The relationship is labelled as "Registered_EirCode" and has a property called "Postal_Code" with the value of a
row.EirCode, which is the EirCode value we are using to make the connection.
In simpler terms, the code creates nodes representing counties and EirCodes and connects them with a relationship that signifies the registration of a county with a specific EirCode. This allows us to query and analyse the data based on county-EirCode relationships in the graph database.
# This snippet to view the created nodes and edges

MATCH(p)
RETURN(p)

Likewise, we can add as many nodes and edges as possible using the above snippet.
Export of Graph data to GraphML
Exporting the Graph data to GraphMl format is a crucial task. Below is the code snippet for the conversion of graph data to graph Ml formal
🔸 Step-1
CALL apoc.export.graphml.all("rwh.graphml", {})Though it looks like a simple 1 line of code, there are few configuration settings. We need to do this early to avoid the below error!
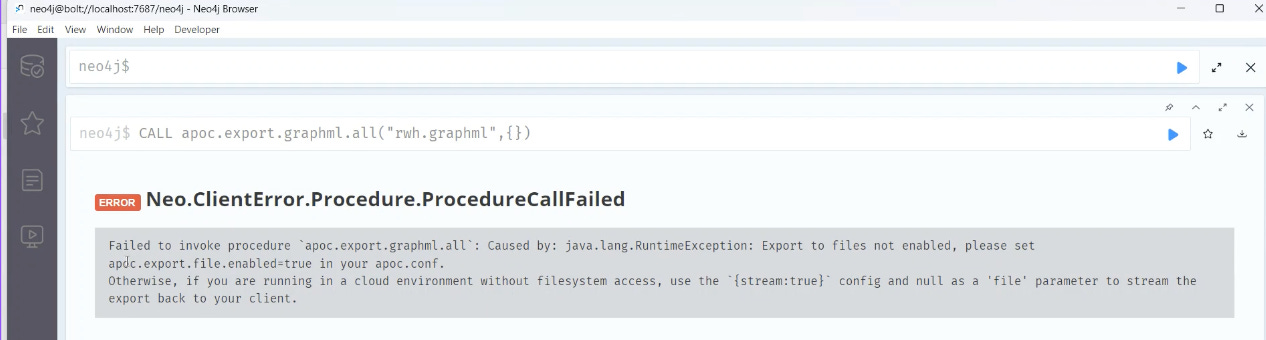
This Error message explains about the Missing or unavailability of the APOC Config file in the path. This has to be fixed manually, and the step-by-step approach is below.
🔸 Step-2
First, click three(dots) next to open icon→ click openfolder→ Import

🔸 Step-3
Once you click on import, you can see our CSV File, which we have imported→ Click on the folder path.
🔸 Step-4
now we can see many sub-folders →Navigate to the ‘ conf ’ Folder

🔸 Step-5
Inside Conf Folder, we can see a lot of Conf files, but there is no Apoc Conf file alone.

As a result, we will create a new Note pad file or a text file, paste the command snippet below, and finally save it as a CONF File.
Apoc.export.file.enabled = true🔸 Step-6
Finally, we will restart the database and then run the cypher query below. The Graphml extension file will be saved in the project location.
CALL apoc.export.graphml.all("file_name.graphml", {})Importing Graphml File in Python.
NetworkX
Network x library is a Python package for the creation, manipulation, and study of the structure, dynamics, and functions of complex networks.
Below is the snippet for importing and loading the graph
import networkx as nx
import numpy as np
from torch.utils.data import DataLoader

# Step 1: Load the GraphML data
graph = nx.read_graphml('file_name.graphic)
To Visualize the Graphml data
import matplotlib.pyplot as plt # Visualize the graph

plt.figure(figsize=(20, 13))  # Set the size of the figure

nx.draw(graph, with_labels=True)  # Draw the graph with labels

plt.show()  # Display the graph
Finally, we successfully converted the tabular CSV data to graph data and exported the graph data to GraphML format data.
Utilising Python to visualise the Graphml data for further GCN or other graph-based algorithm implementation.
Thank you very much, and Stay Tuned for the next Article on GCN Implementation