
Technical Demonstration - Graph Neural Network
An end-to-end link prediction demo on real-time data.

Welcome to today's deep dive into the world of graph building with Neo4j. Whether you're a seasoned data scientist or just starting with graph databases, this article will equip you with essential skills for creating and managing graph data using Neo4j.
We'll cover everything from the basics of node creation and node properties to establishing relationships between nodes and integrating Neo4j with Python. By the end of this article, you'll have a solid understanding of how to build and query graphs within Neo4j efficiently.
Here’s What We’ll Explore:
Creating Nodes and Defining Their Properties in Neo4j
Establishing Relationships Between Nodes
Connecting Python with Neo4j Desktop to Execute Queries
But before we dive in, let’s quickly recap some foundational concepts discussed in our previous articles:
Recap from the previous Graph Data and Graph Convolutional Network-related articles:
🔸 For details on the graph data and Graph Neural Network, Read here.
🔸 For details on Graph ML Practical Applications, Read here.
🔸 Tab2Graph-1 Conversion of Tabular to Graph using Python, Read here
🔸 Tab2Graph- Conversion of Tabular to Graph using Neo4j, Read here.
🔸 Graph Building - Neo4j, Read here.
Members-only Online Hands-on Course on Graph Convolutional Networks
A quick and hands-on course for the CeADAR industry to become familiar with the trending topic of Graph Convolutional Networks: Graph-Based Machine Learning.
From understanding the fundamentals of Graph Neural Networks (GNNs) to hands-on experience with tools like Neo4j and Python, you'll gain the skills needed to construct and analyse graphs effectively.
Additionally, you'll delve into advanced topics such as topological link prediction and building recommendation systems, expanding your proficiency in machine learning techniques. By the end, you'll be equipped to implement graph-based solutions in various domains, making you a valuable asset in data science, development, and machine learning.
Basic Machine Learning and Python, plus a reasonable desktop/laptop to run Neo4j/Python programs, are requirements for this course.
From October 23rd - November 24th.
Lectures and labs on Monday and Friday at 15:00- 16:00.

For Registration Click Here,
Welcome, one and all, to the magical!!!
Contents of the Article
Let’s Jump into the contents of the Article,
A Brief Intro to GCN
A Brief Intro to Graph Data
Graph ML Applications
Use Case Explanation
Project Architecture
Graph Data Science -Neo4j
🔸Graph Data
Let’s Give a Brief Introduction to the Graph Data
Graph data refers to data that is organised and represented using a graph structure.
A graph is a collection of nodes (also known as vertices) connected by edges.
Graph data can describe relationships, connections, or interactions between entities.
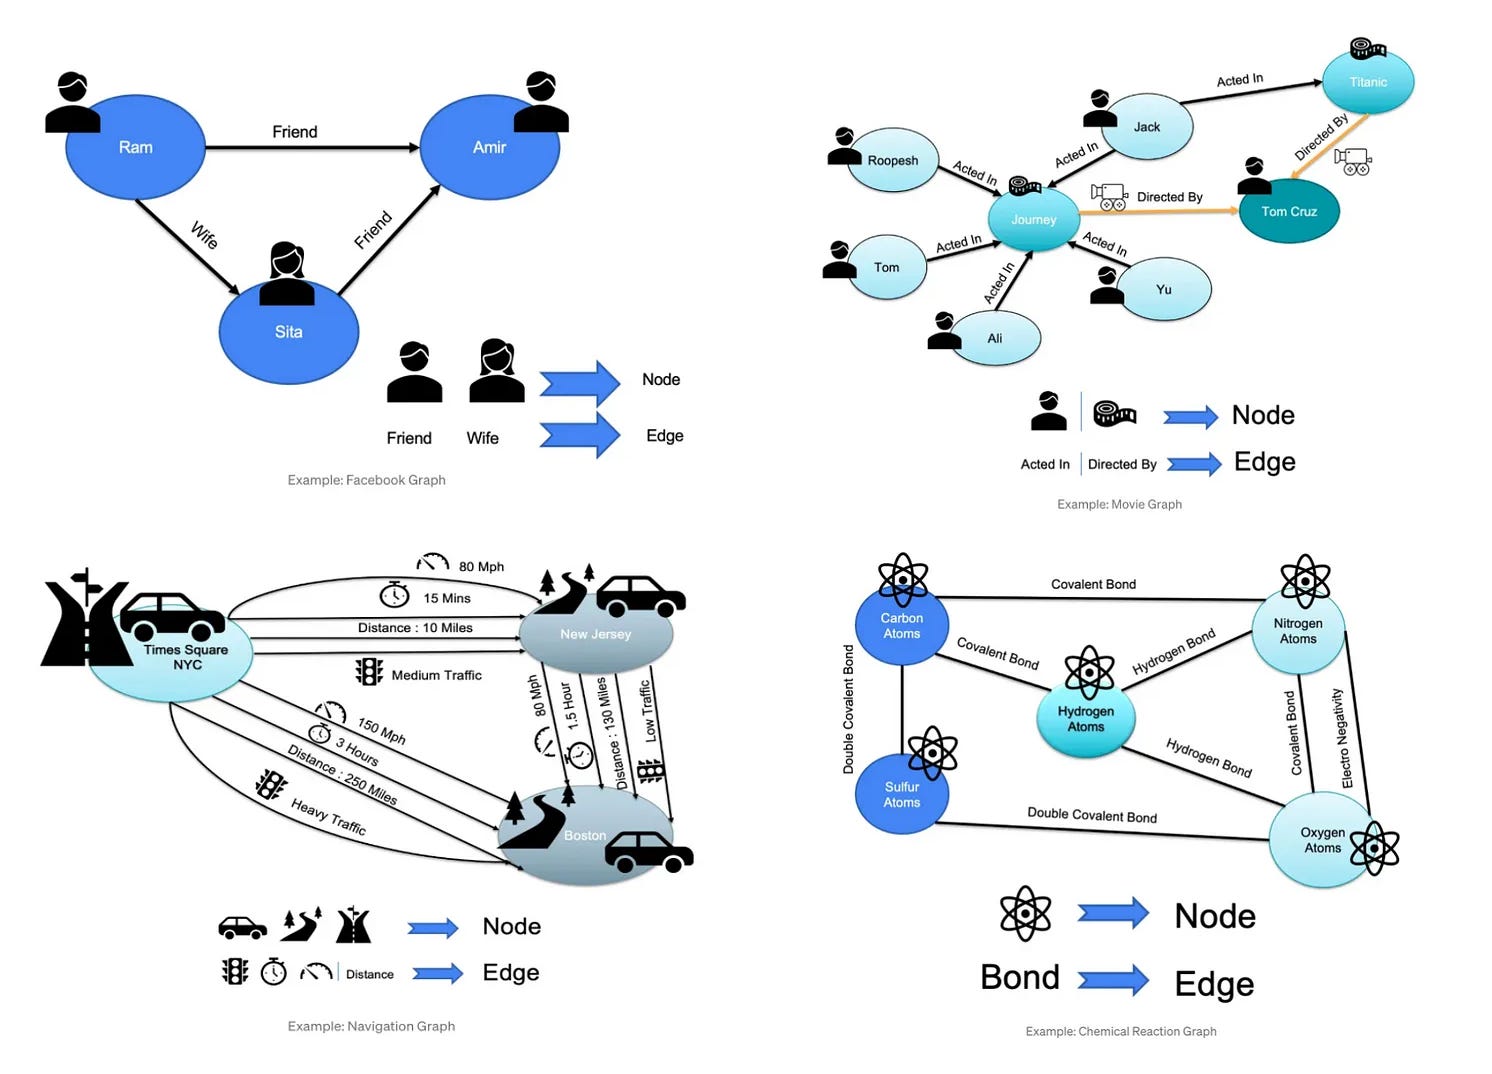
Let’s think of a social network like Facebook, where each user (Ram, Amir, Sita) is a node, and each connection between users (such as a friendship, Wife) is an edge.
further examples such as,
Movie Graph data, Transport Navigation graph data, chemical reactions
🔸Graph Neural Networks
Graph Convolutional Networks use a convolutional graph operation to aggregate information from a node's neighbours and generate a new representation for that node.

This operation can be applied to multiple neural network layers to learn increasingly complex representations.
This can be used for tasks such as Node Classification, Link Prediction, and Graph Generation.
🔸Graph ML Applications
Graph ML applications can be broadly classified into four major categories based on the level at which the predictions are made.

Graph-level prediction involves predicting properties of the entire graph rather than individual nodes or edges.
Node-level prediction involves predicting properties of individual nodes in a graph, such as predicting a node's category or its degree of centrality.
Edge-level prediction involves predicting properties of individual edges in a graph, such as predicting the presence of a link between two nodes or predicting the type of relationship between them.
Subgraph-level prediction involves predicting properties of subgraphs within a larger graph, such as predicting the existence of certain patterns or motifs in the graph.
🔸Graph Link Prediction
Link prediction in Graph Neural Networks (GNNs) is a task that involves predicting the likelihood of a connection (or edge) between two nodes in a graph.
It's a fundamental problem in graph analysis and has various applications, including social network analysis, recommendation systems, biological network analysis, and more.
Let’s start the journey towards Link Prediction for the Remote Working Hub Use case.
Remote working hub across the entire Dublin and its connected amenities.
🔸Use Case Explanation
The main aim of the use case is to find the Link prediction of the remote working hub dataset across Dublin, Ireland.
Remote working hub: It’s also known as a coworking space or a digital nomad hub, and it is a physical location equipped with office facilities where individuals, typically those who work remotely or freelance, can come together to work in a shared environment.
Amenities: They are the [Banks, cycle rentals, gyms, cafes, restaurants, shopping malls, supermarkets, Internet Cafe, Post Office, Bicycle Parking, Parking Entrances, and Parking Spaces]
The main aim of this research is to understand Graph Neural Networks and Graph Data. How effectively can we apply the graph neural networks, and how can we convert the relational data into graph-formatted data and achieve a link prediction to find the closest amenities to a specific remote working hub?
🔸Remote working hub - Project Architecture
The Project Architecture of Graph Machine Learning -Based Link Prediction has been divided into four building blocks,

Data Engineering
Graph Engineering
Graph Data Science
Prediction Score
Data Engineering
Data Engineering is an essential phase of an ML pipeline, where data undergoes several cleaning and feature processing stages.

Likewise, here, we have Geojson raw data containing half a million records of the latitude and longitude of the Remote working hub across Ireland and all the different amenities across every hub, such as ( the bank, atm, restaurant, bar, cafe, bicycle parking, rentals, supermarkets, shopping centres)
Using GeoPy- Library in Python - A Reverse Encoding Strategy is applied.
pip install geopy

from geopy.geocoders import Nominatim
To get information on specific locations, use latitude and longitude.
Graph Engineering
Graph Engineering is one of the complex and challenging tasks as we need to set up the nodes and edges along with their properties for the dataset (Remote work hub data and other 14 amenities datasets)

Each hub and amenity is a node, and their connections between the edges form the relationship.
Each hub has its properties (attributes) like (Lat/Long, Name, Eircode, Address, Special Features, contact info, and all other details).
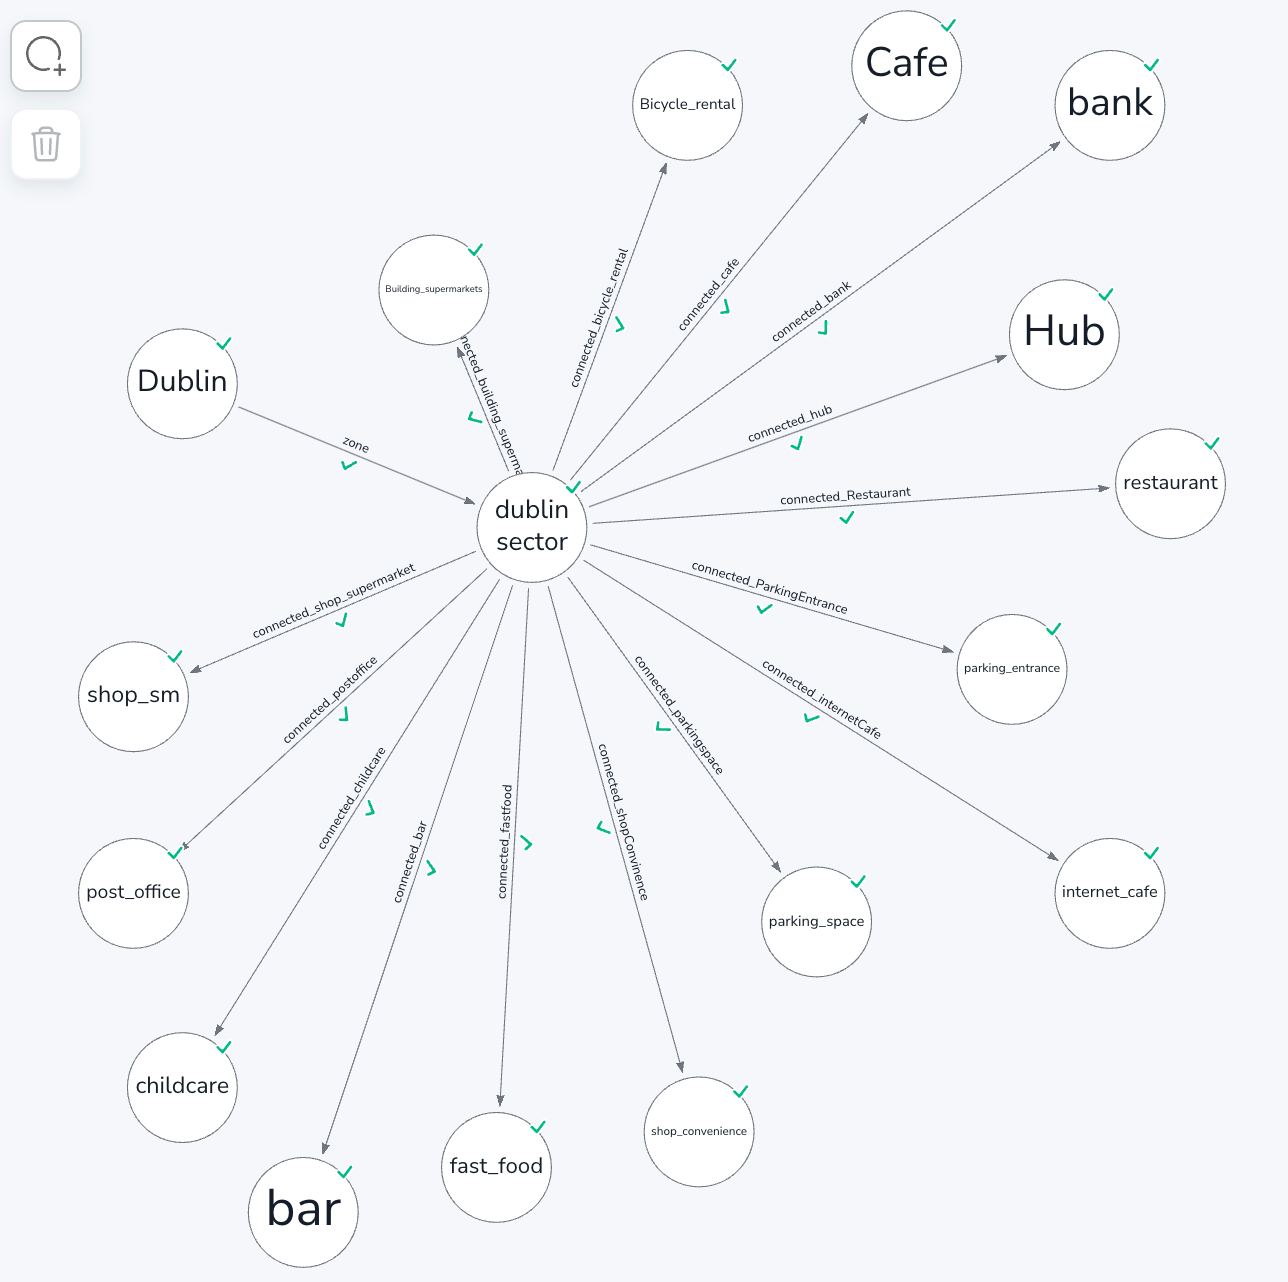
Dublin→ Dublin_Sector→ Eircode[Hub] and Eircode[Amenities]
Interconnection between the nodes is done using Dublin’s entire Eir code
For Example: With an Eir code of “D07 E231”, all amenities located in that Dublin Sector “D07” are mapped together with Hub Dublin.
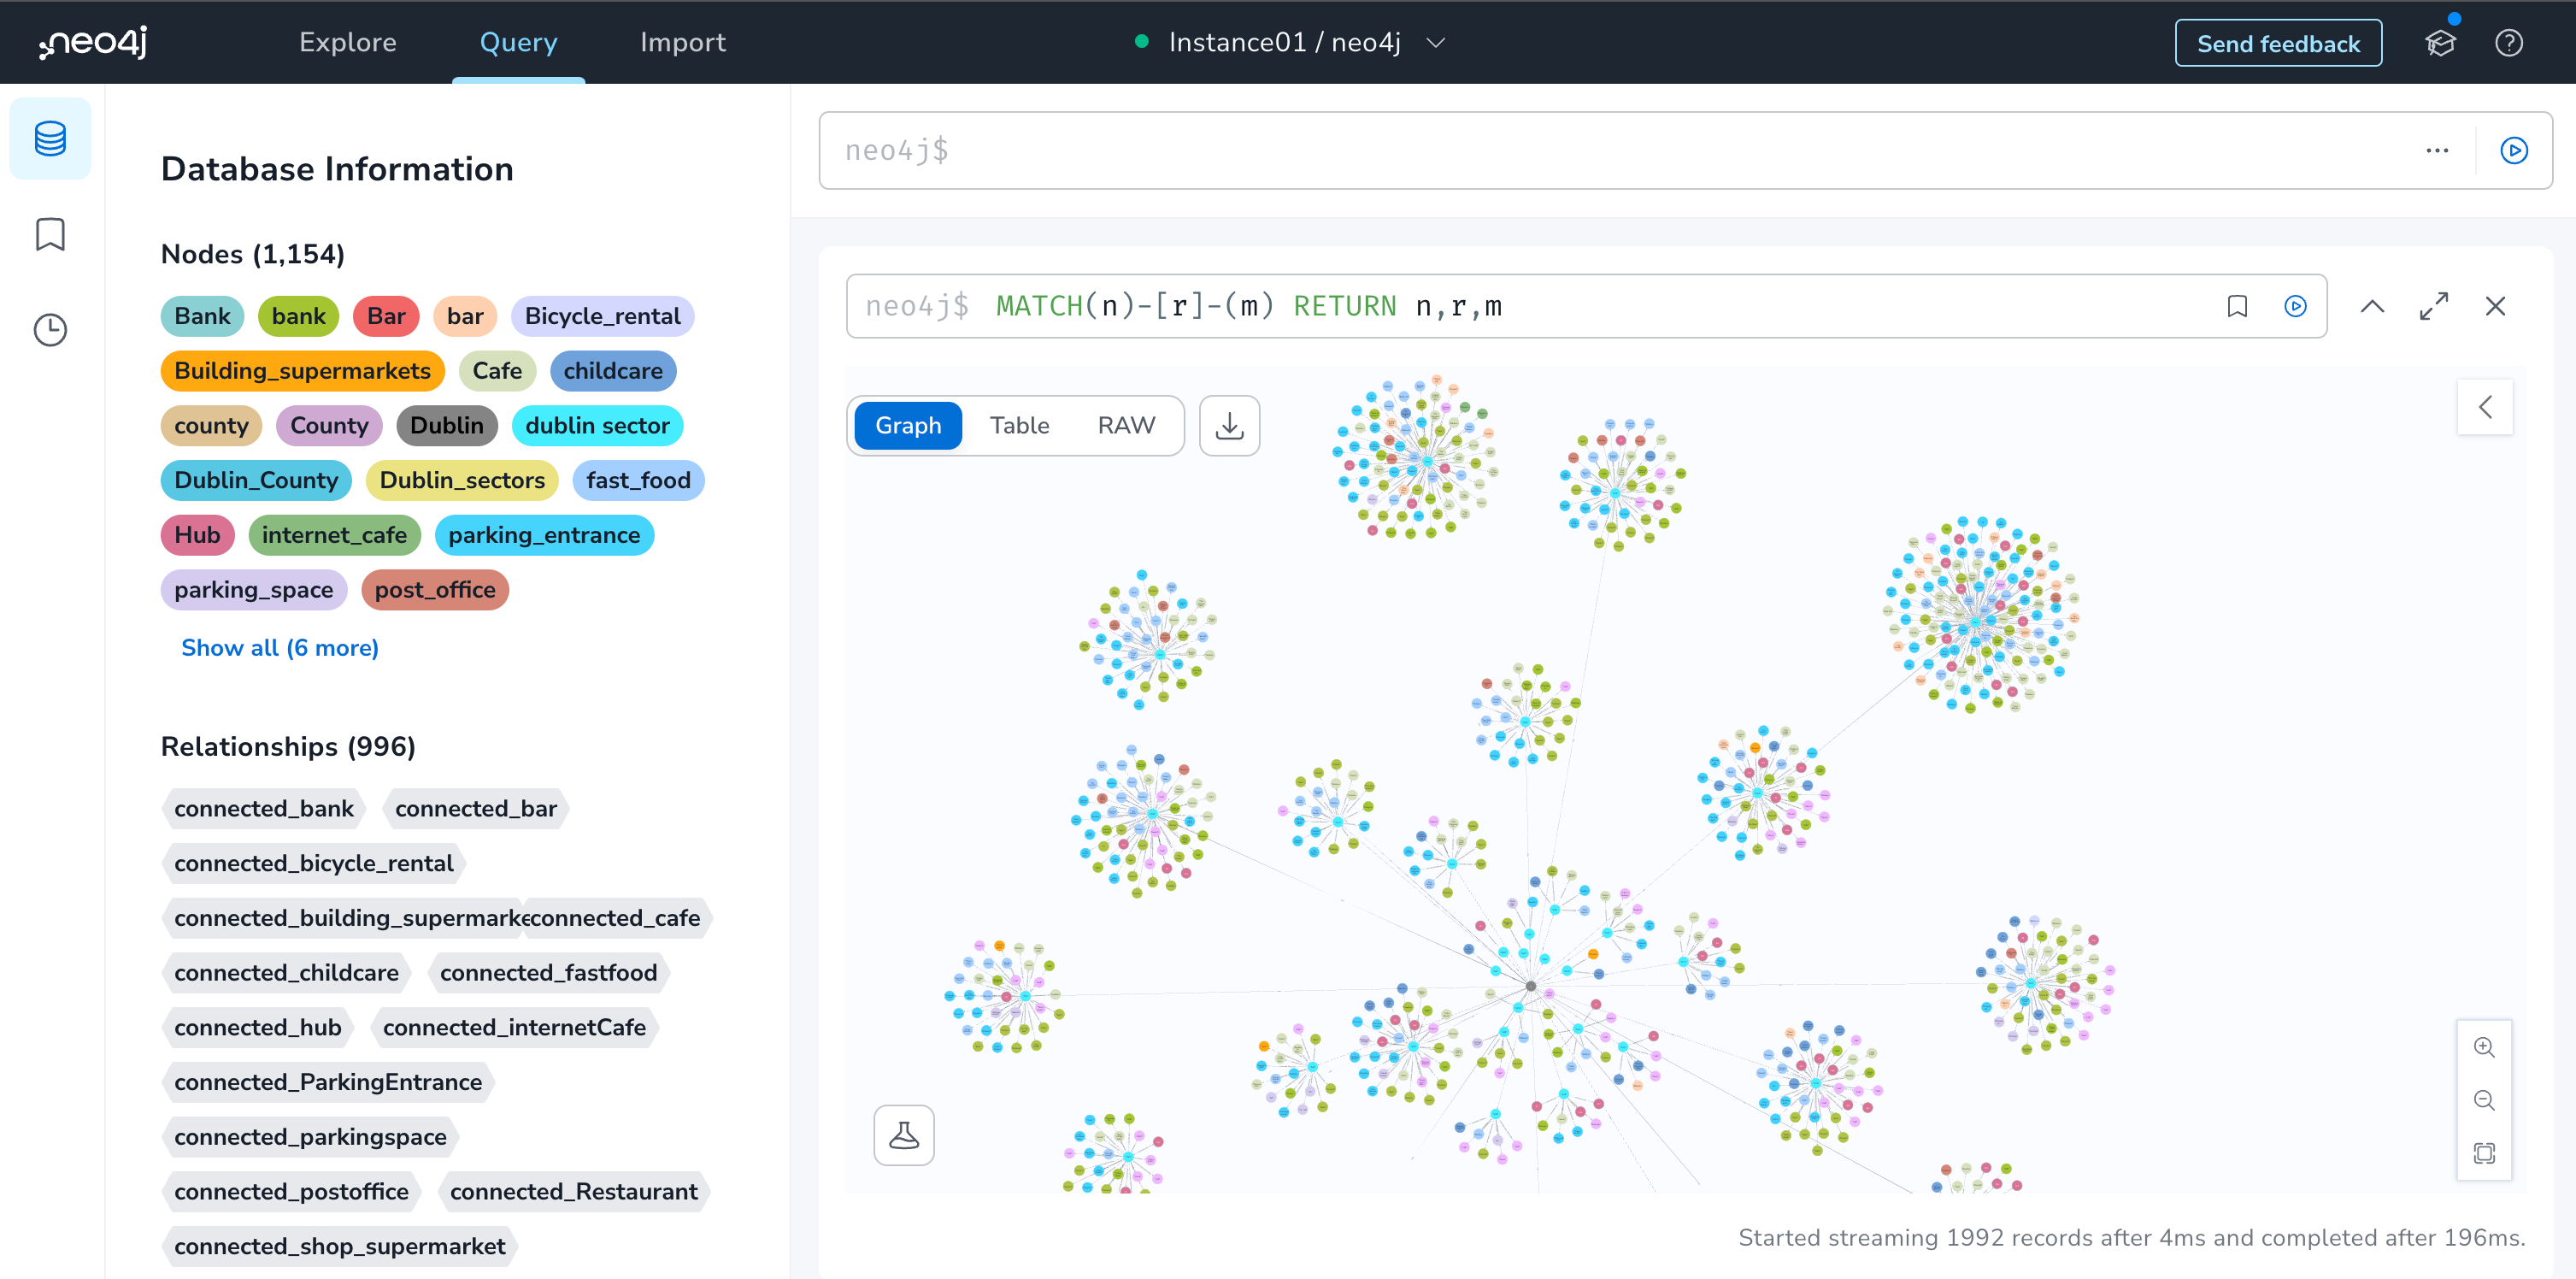
Similarly, all Dublin zones and their connected hub and amenities are mapped together to make a total of 1154 Nodes and 996 Connected relationships.

From this Graph Visualisation, we can see that there are 1154 nodes which have all (hub and amenities connected using the Dublin zones and their Eircodes) and 996 relationships connecting the amenities.
🔸Graph Data Science- Neo4j
Neo4j Graph Data Science is an extension and library for the Neo4j graph database. It empowers data scientists and analysts to perform advanced graph analytics and machine learning directly within the Neo4j environment.

This extension provides a comprehensive set of tools and algorithms specifically tailored for working with graph data. It includes various algorithms for tasks such as community detection, centrality analysis, pathfinding, and more. Additionally, it supports the execution of custom graph algorithms, allowing for tailored analyses based on specific use cases.
Neo4j Graph Data Science is especially beneficial when data relationships are crucial, such as social networks, recommendation systems, fraud detection, and knowledge graph analysis. By harnessing the power of graph analytics, data scientists can uncover valuable insights and patterns within complex, interconnected datasets.
🔸Link Prediction Algorithm Overview
These measures or algorithms are used in graph analytics, particularly for link prediction and community detection. Here's a brief description of each:
Adamic-Adar
Adamic-Adar algorithm Measures the closeness of nodes in a social network based on the number of shared neighbours. It assigns higher importance to shared neighbours that are less common, indicating a potentially stronger connection.
Common Neighbours
Common Neighbours algorithm Reflects the idea that two individuals who share a mutual friend are more likely to be introduced to each other. This measure emphasises the importance of common connections in predicting potential links.
Preferential Attachment
The preferential attachment algorithm assesses node closeness based on shared neighbours, which is particularly applicable to scale-free networks . It operates on the principle that nodes with high degrees are more likely to attract new connections.
Resource Allocation
The resource allocation algorithm Evaluates node closeness by considering shared neighbours. Notably, this measure ensures that many links are assigned different scores when only information about nearest neighbours is deemed.
Same Community
The same community algorithm Determines whether two nodes belong to the same community within a network. These communities can be identified using community detection methods, and this measure helps assess intra-community connections.
Total Neighbors:
The total neighbors algorithm quantifies node closeness based on the count of unique neighbours. It operates on the principle that highly connected nodes are more likely to receive new links.
These measures play critical roles in tasks like link prediction, suggesting potential connections, and determining community structures within a graph. Understanding and appropriately applying these measures is fundamental in graph analysis, particularly in scenarios like social networks, recommendation systems, and community detection in various networks.
🔸Experimentation
In the Experiment, after successfully creating the Graph Mapping Graph object from the Neo4j, we can use the Neo4j- Graph Data Science Library.
The topological link prediction algorithm can be used directly with the Neo4j Cypher queries or using Python -Driver for Neo4j.
We have calculated all 6 Algorithm on several combination
Using the Graph Data Science Library of Neo4j, we have computed all possible combinations around 68K records of scores across all hubs and the amenities of the remote working hubs
From that, we found that preferential attachment scores are much more detailed and more resourceful based on our graph architecture [Scale-Free Networks]
Example of Cypher Query using the Neo4j

# Preferential Attachment Score fr HUB- BANK

Match (hub:Hub),(bank:bank)

RETURN hub.Hub_Name as hub_name, hub.EirCode as hub_eircode, bank.name as bank_name, bank.eircode as bank_eircode,
gds.alpha.linkprediction.preferentialAttachment(hub,bank) As score;
From the Preferential Attachment scores of HUB- BANK
D07CX22- ( Hub ) → D02 KX03-( Bank ) = 25.0 ← Distance-( 3.5 KM )
D07CX22-( Hub ) → D02VR66-( Bank ) = 35.0 ← Distance-( 2 KM )
The distances mentioned above are the actual Google Distance Matrix API’s shortest distances.
We have also calculated the Manhattan distance to find the distance based on the Latitude and Longitude.
From this, we can say that the lower the distance, the higher the scores of the Link prediction.
Finding a correlation analysis between the distance and the scores shows a negative correlation
Negative Correlation means distance, and the scores are inversely proportional (a) and vice-versa.

🔸 Observation
"We are pleased to highlight that this resource is a valuable tool for businesses considering establishing in a specific community. It offers insights into the accessibility of the area, enabling potential entrepreneurs to make informed decisions.
Furthermore, this tool proves invaluable to amenity providers such as banks, ATMs, cycle rentals, gyms, cafes, restaurants, shopping malls, supermarkets, hospitals, and bus stops. It assists them in gauging their connectivity, identifying opportunities, assessing local competition, and projecting growth potential.
By leveraging this tool, businesses can make strategic choices about where to set up, ensuring they tap into the full potential of their chosen locality."
The detailed Video explanation of this tech demo can be viewed Here.
Don’t Forget to Register the Course !!!
The Power of Graph Convolutional Networks- Master Graph-Based Machine Learning.
Thank you very much for reading the content !!
Stay Tuned for the Next Interesting article on Graph Neural Networks !!!!